A/B testing Implementation Using Python
16 Mar 2023 - Sakar Mainali
In the business domain, it’s important to recognize the significance of using data to make informed decisions that can improve the efficacy of the product or marketing strategies. A/B testing or Bucket testing is a widely used and highly effective statistical method for optimizing digital assets such as web pages, emails, and ads. By testing different variations of these assets, businesses can gather valuable data on how each version performs and use that information to make data-driven decisions about which elements to include or remove. A/B testing can be used to optimize a variety of factors, including headlines, images, copy, calls-to-action, and more, and can lead to significant improvements in key metrics such as click-through rates, conversion rates, and revenue. This blog post will guide you through a detailed process for implementing A/B testing along with an example implementation using python.
A/B Testing Steps
Step 1: Define Your Hypothesis
Before you begin your A/B test, you need to define your hypothesis. What is it that you want to test? What is the outcome you want to achieve? Your hypothesis should be specific, measurable, and achievable. For example, your hypothesis might be that changing the color of your call-to-action button will increase click-through rates.
Step 2: Identify Your Variables & Variations
Once you have defined your hypothesis, you need to identify the variables you will test. In the example above, the variable you will test is the color of your call-to-action button. You might test different variations, such as red, green, or blue.
Next, you need to create your variations. You might use a website optimization tool, such as Optimizely or Google Optimize, to create different versions of your webpage or you might manually create different variations of your marketing campaign.
Step 3: Split Your Traffic & Collect Data
Once you have created your variations, you need to split your users traffic evenly between them. This can be done using a randomization tool or by manually splitting your traffic.
After the traffic is split, you need to collect data on how each variation performs. You might track metrics such as click-through rates, conversion rates, or revenue generated.
Step 4: Analyze Your Data
After you have collected data, you need to analyze it to determine which variation performed better. This can be done using statistical analysis tools, such as Excel, R, or Python. You might use a t-test or chi-square test to determine statistical significance.
Step 5: Draw Conclusions
Based on your analysis, you can draw conclusions about which variation performed better and why. You can then use these insights to make data-driven decisions about how to improve your website or marketing campaign.
Implementation Example in Python
Suppose you run an online store and you want to test whether a new version of your product page leads to increased revenue. You have two versions of the product page: the original version (control) and the new version (variant). You want to test which version leads to more revenue generation. For this, we’re taking one suitable example dataset from kaggle. We’ll be exploring this dataset in details afterwards but for now lets go through each steps in A/B testing
Step 1: Define Your Hypothesis
As we want to test which version leads to more revenue generation, let us define our hypothesis below:
Hypothesis: The new version of the product page (variant) will lead to more revenue than the original version (control).
NULL Hypothesis : There is no statistically significant difference in revenue between the two versions of the product page.
Step 2: Identify Your Variables & Variations
Variable: Version of the product page (control or variant)
Step 3: Split Your Traffic & Collect Data
As mentioned earlier, we’re taking an example dataset from kaggle dataset: (https://www.kaggle.com/datasets/sergylog/ab-test-data). Let’s import and explore this dataset
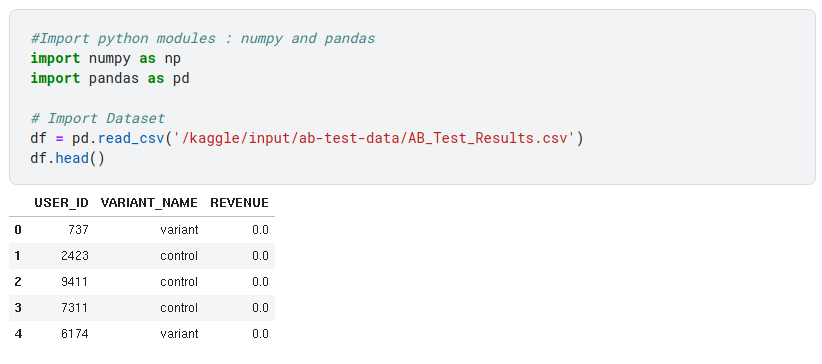
As we can see that the dataset consists of three fields:
USER_ID — Unique identifier to track each user
VARIANT_NAME — Version of the page i.e. the original version (control) and the new version (variant)
REVENUE — Income brought by the user
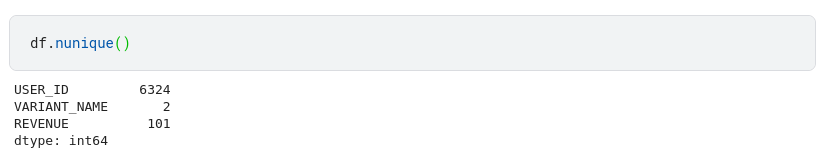
Lets us check unique values in each fields and descriptive summary statistics

Let us check how the data is distributed using a box plot
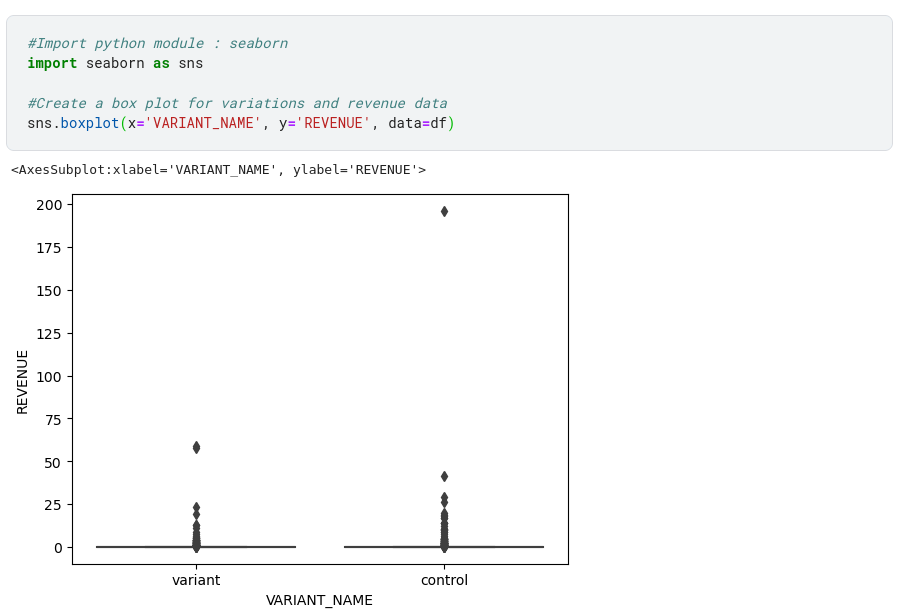
It can be seen from the plot that there is a strong outlier in the data. Lets find this by sorting these revenue values in descending order and looking at the top 10 values
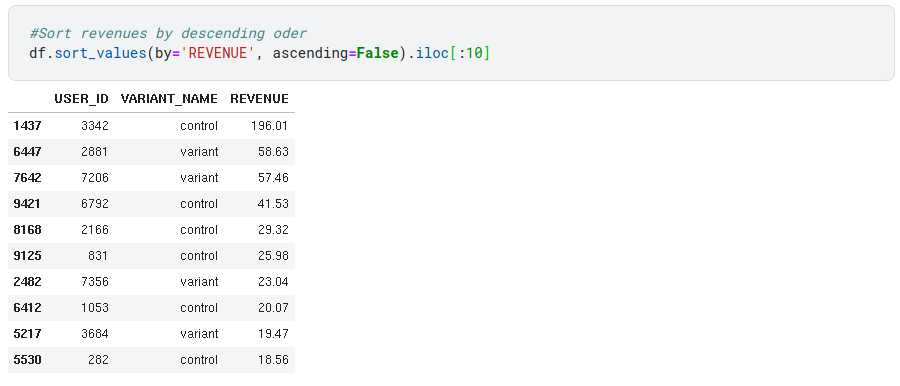
Here we can observe that user with id : 3342 has a high outlier revenue data
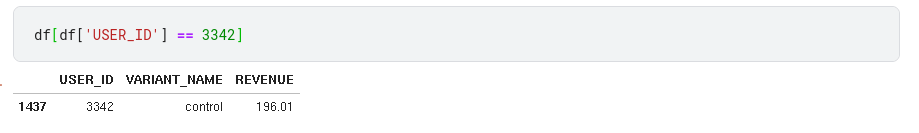
We see that there is only one outlier, so we’ll remove this entry and look at the distribution of data again
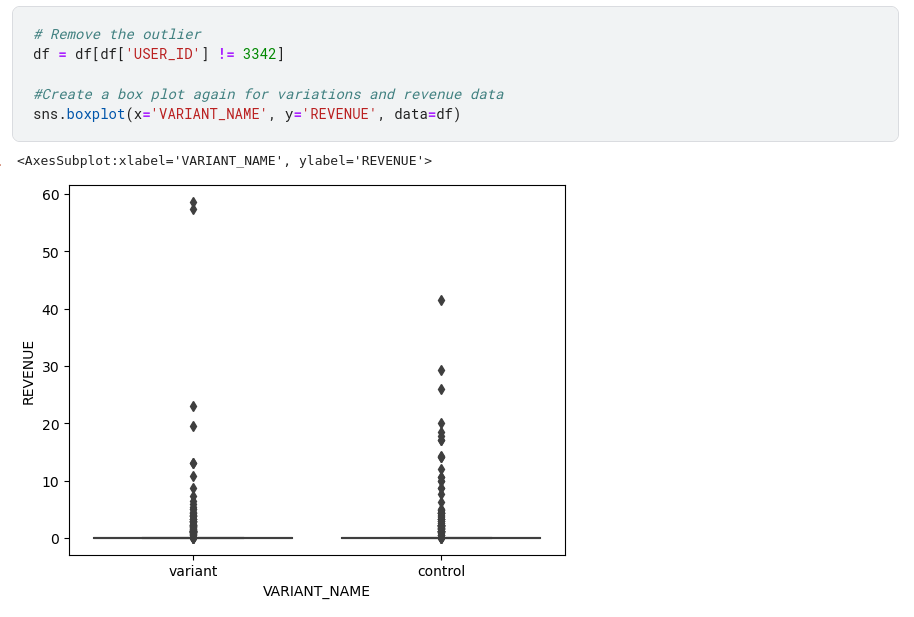
Now lets split revenue between the two versions of the page i.e. the original version (control) and the new version (variant).

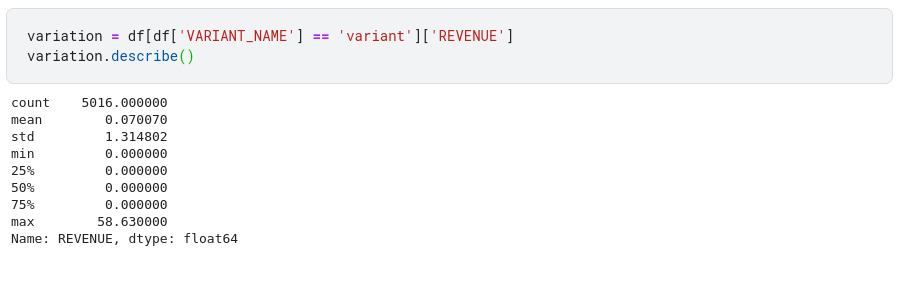
It is usually recommended to split the variant and control group equally in A/B testing to ensure that any differences in the test results are not due to an uneven distribution of participants between the groups. Let’s go ahead by taking a minimum sample size and randomly sample equal number of data points from each group
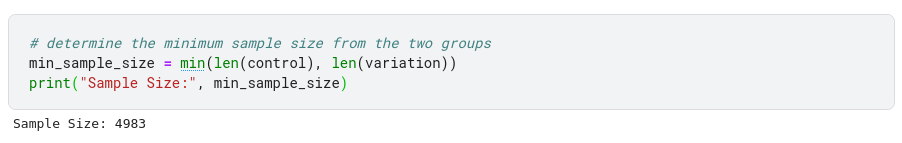
# Randomly sample equal number of data points from each group

#For control group\
control = np.random.choice(control, size=min_sample_size, replace=False)

#For variation group\
variation = np.random.choice(variation, size=min_sample_size, replace=False)
Step 4: Analyze Your Data
Here we want to test whether a new version of the product page leads to increased revenue. For this, we can use a t-test to determine if there is a statistically significant difference in the revenue between two versions of the product page. Here we’re using test_ind module from scipy python library to calculate the t-test for the revenues.
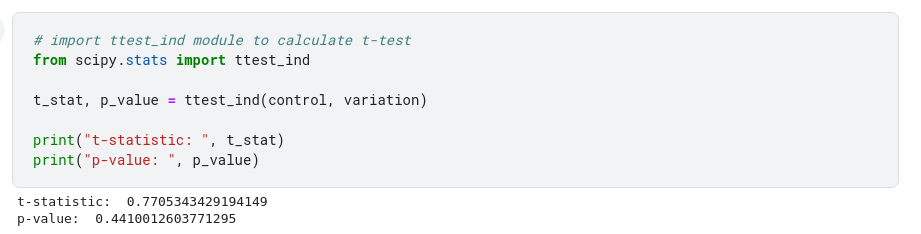
Here we can see that the p-value obtained from the t-test is around 0.4
Step 5: Draw Conclusions
If the p-value is less than 0.05, we can reject the null hypothesis and conclude that there is a statistically significant difference in revenue between the two versions of the product page. Furthermore in this case we can conclude that the variation or control versions of the product page led to higher revenues based on their means. Otherwise we have to accept the null hypothesis. Lets implement this in code
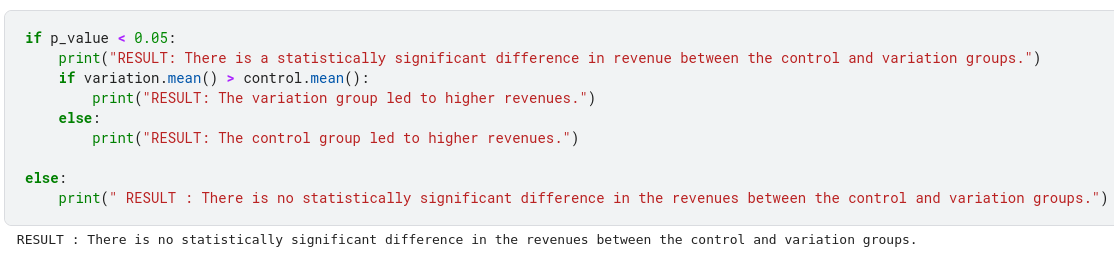
Finally we can conclude that there is no statistically significant difference in the revenues between the control and variation groups. So our original hypothesis:” The new version of the product page (variant) will lead to more revenue than the original version (control). “ can be rejected. So now you should be confident to change the current variation in the web page and began experimenting with other variations.
Conclusion
In conclusion, A/B testing is an essential tool for businesses to improve their website’s performance, user engagement, and ultimately, their bottom line. With the help of Python and its various libraries, implementing A/B testing has become much more accessible and streamlined. By following the steps outlined in this blog post, you can get started with A/B testing in Python, create reliable experiments, and analyze the results to make data-driven decisions. Finally keep in mind that A/B testing is an iterative process, and it’s essential to continually analyze and improve your experiments to achieve the best results.
Kaggle Notebook : https://www.kaggle.com/code/sakarmainali/a-b-testing-implementation-using-python/
REFERENCES
- https://en.wikipedia.org/wiki/A/B_testing
- https://app.datacamp.com/learn/courses/ab-testing-in-python
- https://www.kaggle.com/code/sergylog/ab-test-data-analysis
Code for Nepal would like to thank DataCamp Donates for providing Sakar, and several other fellows access to DataCamp, to learn and grow.