Deciphering Trends and Patterns in Electric Vehicle Adoption, A Comprehensive Analysis
18 Dec 2023 - Pradipti Simkhada
The world of electric vehicles (EVs) is evolving rapidly, marked by technological advancements and a growing shift towards sustainable transportation. With a dataset encompassing 32,783 entries and 17 columns sourced from (https://catalog.data.gov/dataset/electricvehiclepopulationdata), my analysis focused on understanding various facets of this transformative landscape.
Dataset Overview
This dataset offered a comprehensive view of EVs, detailing aspects such as VIN (Vehicle Identification Number), model year, make, model, electric range, base manufacturer’s suggested retail price (MSRP), and geographic distribution.
Data Preprocessing
To streamline the analysis, we initially narrowed our focus to cars manufactured in 2022 onwards, creating a subset called electric_v_from2022. This subset comprised 12,655 entries
and underwent essential preprocessing steps. Null values were identified in columns like ‘Model’ and ‘Legislative District,’ amounting to 68 and
3 missing entries, respectively. These missing ‘Model’ values were meticulously filled based on ‘Model Year’ and ‘Make’ using a mapping technique, ensuring data integrity. Additionally, columns like ‘Postal Code,’ ‘Legislative District,’ ‘DOL Vehicle ID,’ and ‘Vehicle Location’ were deemed irrelevant for our analysis and were dropped, refining the dataset further.
Key Insights
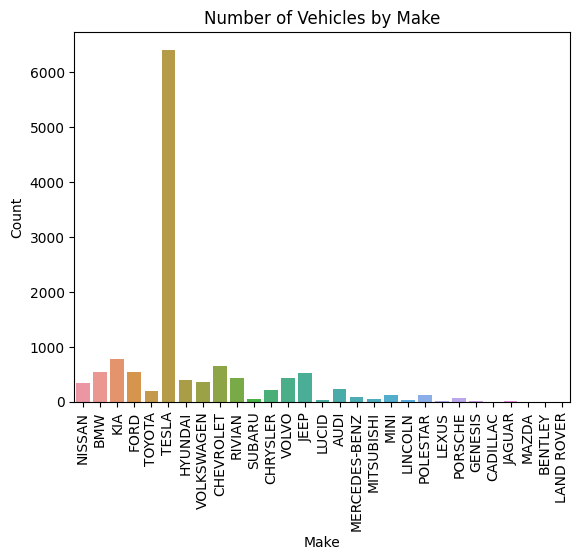
Make wise Distribution
The dataset revealed Tesla as the dominant player in the EV market, with 15,510 entries, followed by Nissan (3,150) and Chevrolet (2,611). This highlighted Tesla’s significant presence compared to other manufacturers in the EV space.
Manufacturer Trends by Year
An analysis based on the number of cars manufactured each year showcased a substantial
increase in 2022, with 7,016 entries, followed by 2023 (5,632) and 2021 (4,429). This indicated
a rising trend in the production of EVs, particularly in recent years.

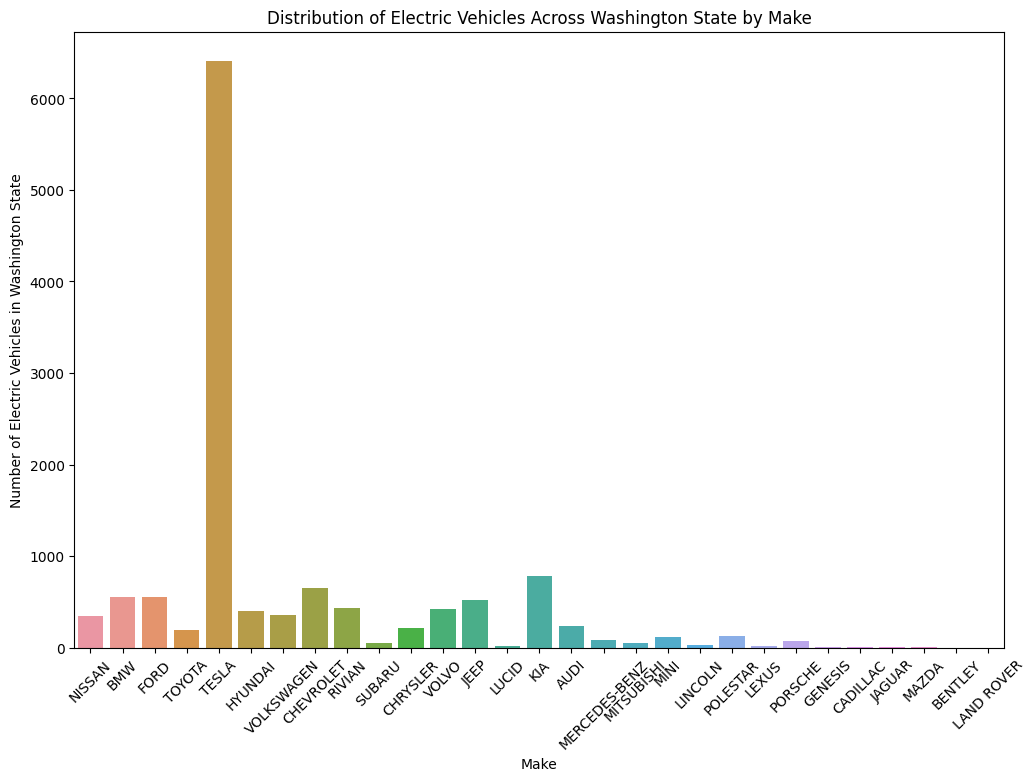
State-wise Manufacturer Preferences
Geographical distribution of EVs across states and counties, although not provided directly, was visualized through bar plots and count plots, shedding light on regional preferences and adoption rates.
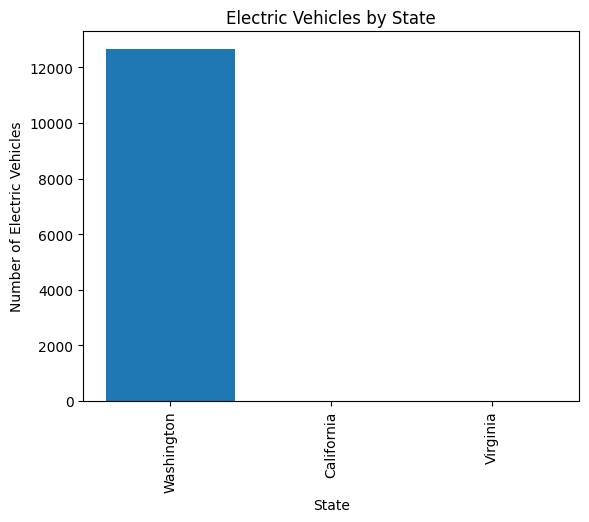
Further exploration into specific states, like Washington State, portrayed the prevalence of different electric vehicle makes across counties. This analysis shed light on regional preferences, offering insights into localized consumer choices.
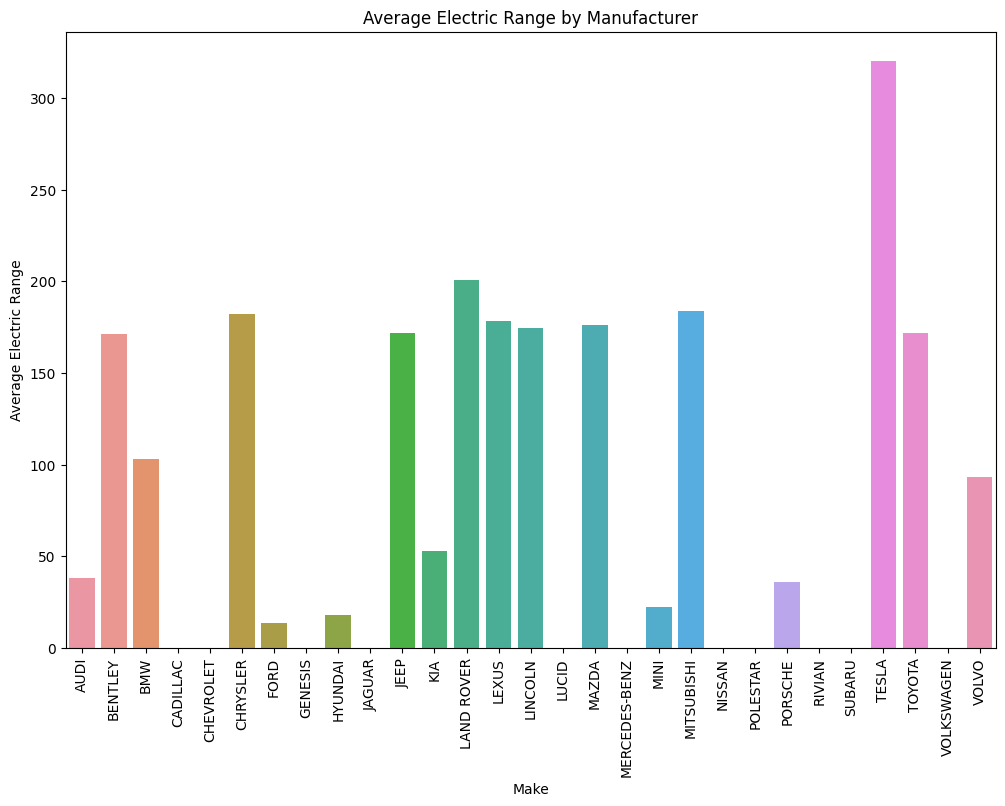
Manufacturer Analysis
Delving deeper into manufacturer trends, it’s evident that each manufacturer has its average electric range. Brands like Tesla, Toyota, and Mitsubishi showcase high average electric ranges, indicating a strong focus on longer-range vehicles.
Conclusion
This analysis serves as a testament to the diverse landscape of electric vehicles, highlighting trends in manufacturing, makewise distribution, and regional preferences. It underscores the growing importance of sustainable transportation and the significant role data analysis plays in
understanding and navigating this transformative industry.
As the world shifts towards greener alternatives, the insights gleaned from this analysis can guide stakeholders in policymaking, manufacturing strategies, and consumer preferences within the electric vehicle domain.
Code for Nepal would like to thank DataCamp Donates for providing Pradipti, and several other fellows access to DataCamp, to learn and grow.