Decoding Trends of NEPSE stock data
27 Dec 2023 - Mijahla Shakya
In the world of stocks, data holds the key to understanding how the markets move. All the investments have a degree of risk. But stocks have considered to outperform most other investments over the long run.
NEPSE(Nepal Stock Exchange) is the primary stock exchange of Nepal, provides a platform for the transaction of stocks, bonds through member, market intermediaries like brokers. NEPSE has a become a key player in the country’s financial market, facilitating the trading activities of listed 226 companies as of June 2023. The NEPSE Index is the capitalization-weighted index of all stocks on the Nepal Stock Exchange. Reflecting the large market capitalization of many Nepalese banks, the index is said to predominantly reflect the banking sector.
In the context of this topic, I collected data-wise indices from the NEPSE’s website and as the download option was not available, I used web scraping to get the required data.
Web scraping is used to extract data from websites. It automates the process of fetching web pages, extraction of the necessary information from them and writing it to a file.
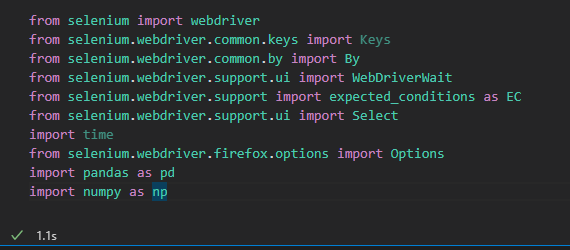
Importing Libraries for web scraping
I used Selenium to web scrape as the data was dynamic and required interaction with the website to filter the number of items per page.
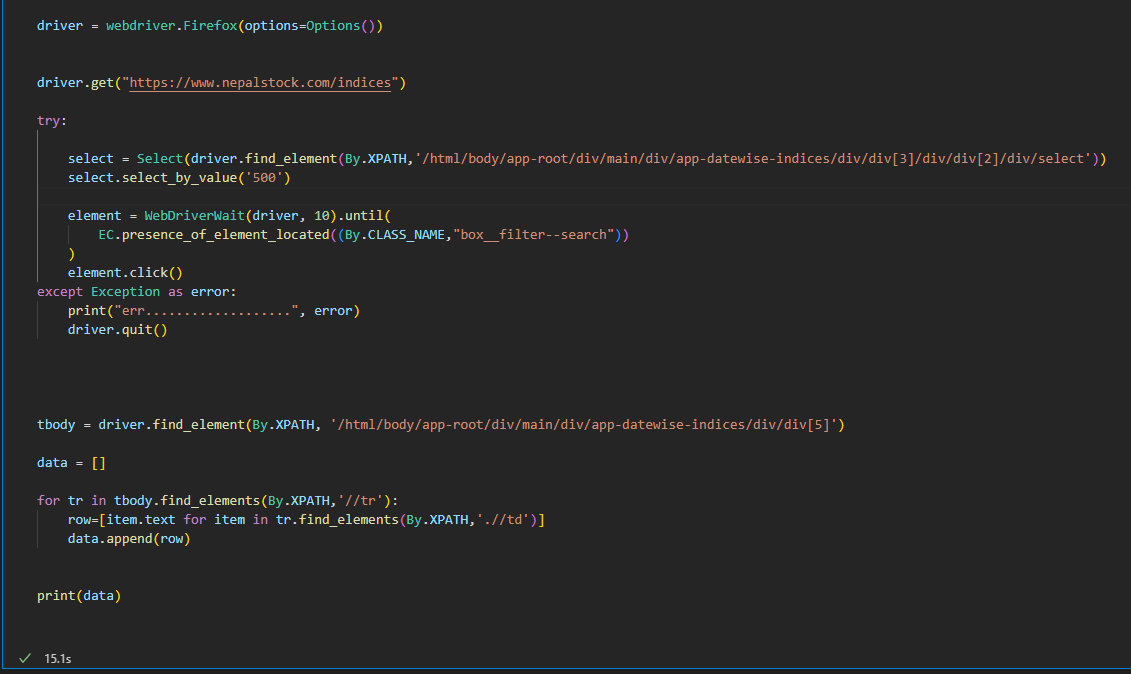
Setting up the Selenium Web Driver
Here, Firefox is used as the Web Driver instance. driver.get navigates to the website. The try block performs actions on the webpage, in this case clicks the drop-down menu of items per page and selects 500 and filters the data on the page. Then the rows of the data on the webpage is scraped.
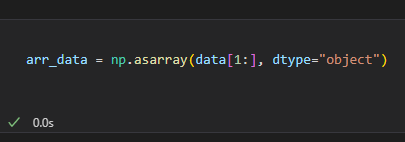
The scrapped data is converted to an array using asarray from NumPy library.
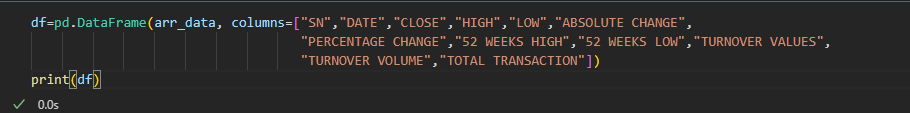
The data in array form is again converted to two-dimensional, tabular data structure DataFrame using pd.DataFrame in order to perform operations on the data.
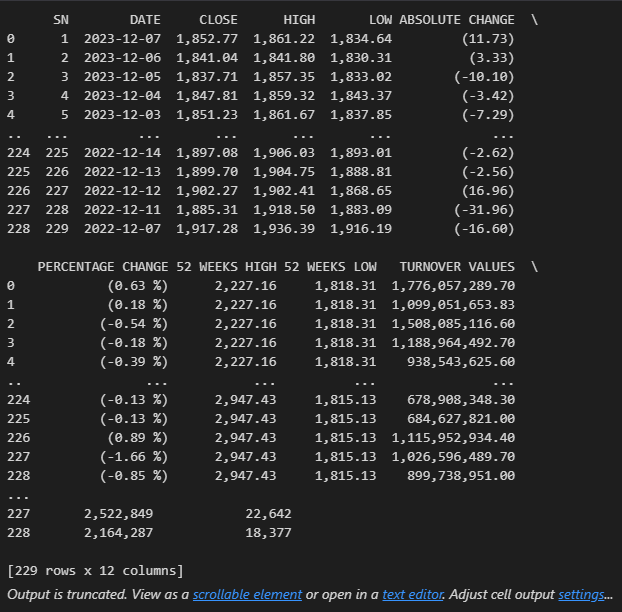
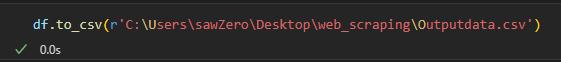
The data above is written to a CSV(Comma-Separated Values) file as Outputdata. Finally the content is saved as a CSV file and can be used for analysis.
Importing the python libraries and loading dataset
import pandas as pd import numpy as np import matplotlib.pyplot as plt import seaborn as sns import plotly.express as px
The data is loaded and thousands=',' is used to have the numeric data as float and integer data types which would be otherwise object.
Loading the dataset
data = pd.read_csv(r"Outputdata.csv",thousands=',')
data
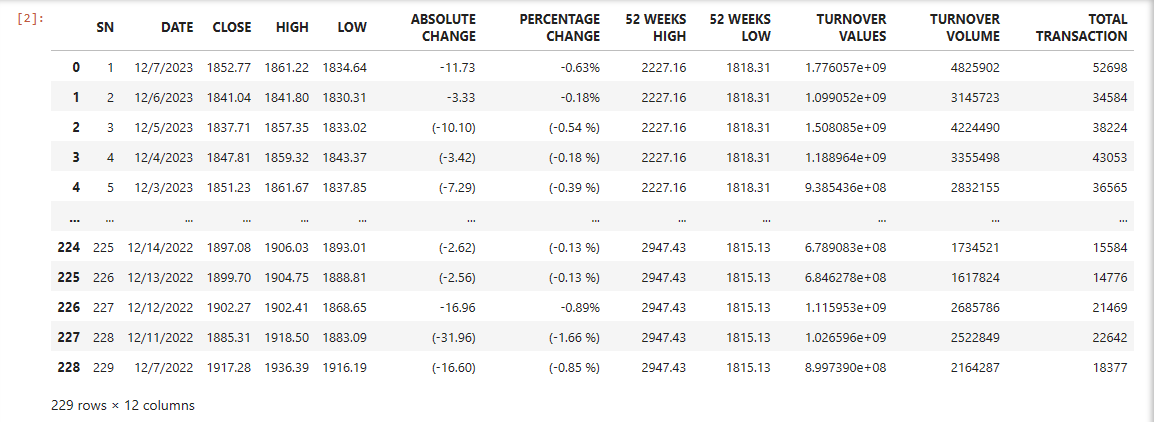
Some of the columns are removed so that it is easier to work with the data.
data= data.drop(columns=['SN','ABSOLUTE CHANGE', 'PERCENTAGE CHANGE', 'TURNOVER VALUES'], axis=0)
data.head()
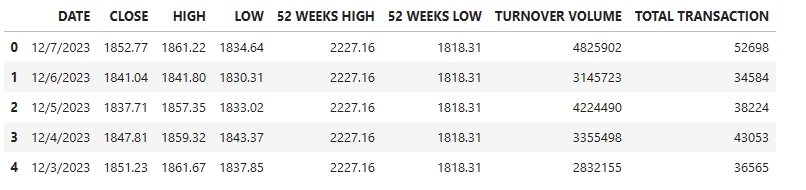
We can see that some of the columns have been removed.
data.tail()
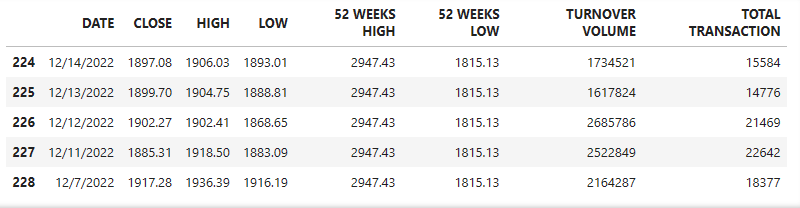
data.shape

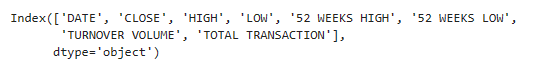
data.columns
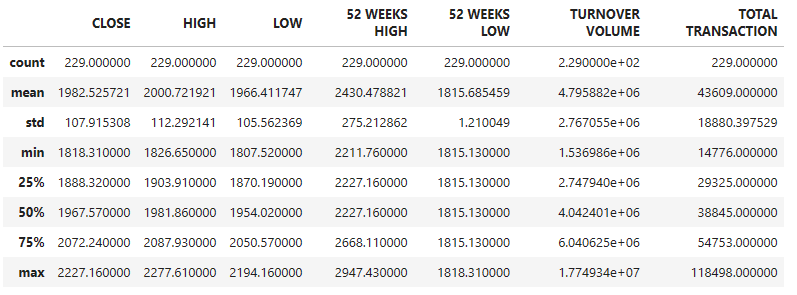
data.describe()
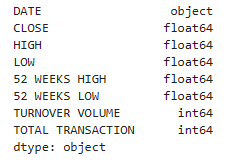
data.dtypes
data.drop_duplicates(keep=False, inplace=True)
data["DATE"]= pd.to_datetime(data["DATE"])

q1= data['CLOSE'].quantile(0.25)
q3= data['CLOSE'].quantile(0.75)
iqr = q3-q1
upper_bound = q3 + 1.5 * iqr
data= data[data['CLOSE'] <= upper_bound]
Data Visualization
plt.figure(figsize=(10, 6))
sns.lineplot(x='DATE', y='CLOSE', data=data)
plt.title('Closing Stock Price Over Time')
plt.xlabel('Date')
plt.ylabel('Closing Stock Price')
plt.show()
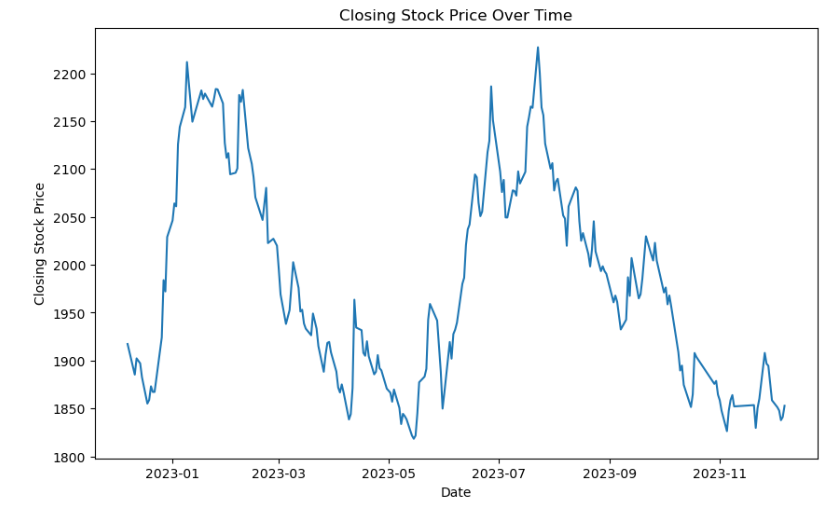
From the plot, it can be seen that the closing stock prices slightly increased over time with fluctuations.
data['year'] = data['DATE'].dt.year
sns.boxplot(x='year', y='CLOSE', data=data)
plt.title('Closing Stock Prices by Year')
plt.xlabel('Year')
plt.ylabel('Closing Stock Price')
plt.show()
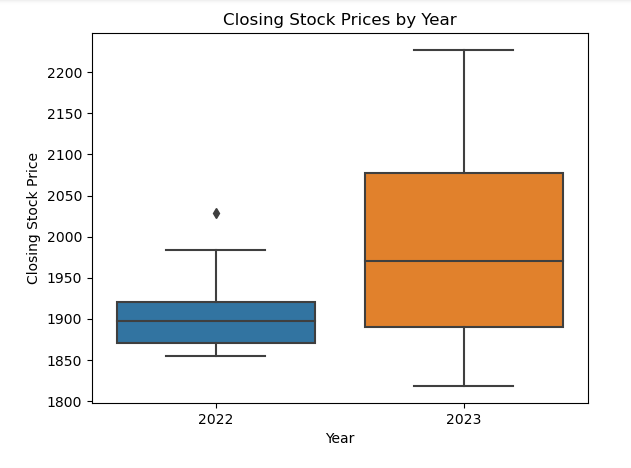
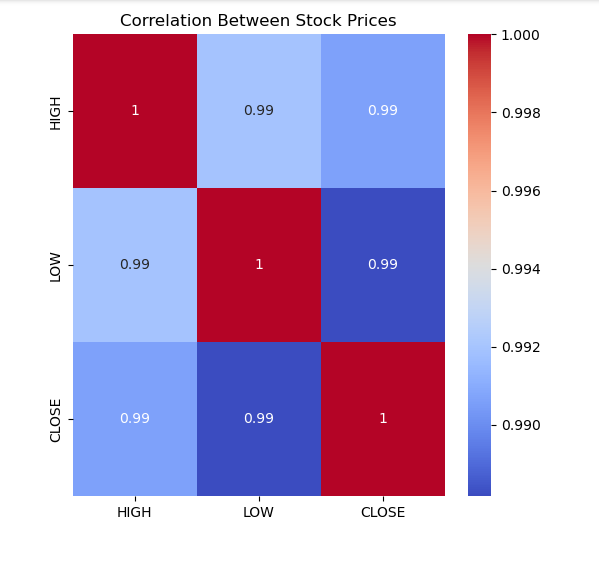
The stock prices have increased drastically compared to the past year. A heat map can be used to visualize correlation between the stock prices using seaborn.
corr = data[['HIGH', 'LOW', 'CLOSE']].corr()
plt.figure(figsize=(6,6))
sns.heatmap(corr, annot=True, cmap='coolwarm')
plt.title('Correlation Between Stock Prices')
plt.show()
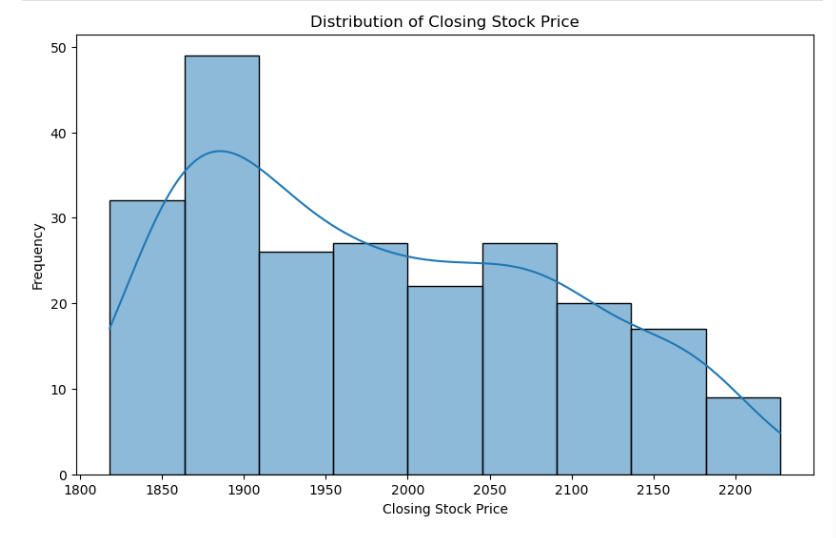
We can also visualize the distribution of closing stock price using a histogram.
plt.figure(figsize=(10, 6))
sns.histplot(data['CLOSE'], kde=True)
plt.title('Distribution of Closing Stock Price')
plt.xlabel('Closing Stock Price')
plt.ylabel('Frequency')
plt.show()
Code for Nepal would like to thank DataCamp Donates for providing Mijahla, and several other fellows access to DataCamp, to learn and grow.